
Housing Market Preview 2026


The frenzy of the housing market was one of the top economic stories of the first half of the 2020’s. Rapidly rising prices, fierce bidding wars, cash offers sight unseen, houses sometimes not lasting on the market for more than a few hours let alone a few days or weeks — the U.S. housing market has never seen anything quite like it.
There were several catalysts for the surge, including, most notably, low interest rates, but also abnormally high demand during the pandemic. This demand was fueled by the rise of remote work and the movement of people around the country, but also because millions of Americans started focusing more inwardly on their homes for satisfaction and fulfillment during the pandemic.
This surge in demand ran smack into a glut of supply following a period of underbuilding from 2010-2020. Acute supply chain issues during the pandemic for everything from lumber to bathtubs to garage doors didn’t help the situation, either. The result was higher prices for homes and frustrating delays for construction and renovations.
The housing story shifted in 2025, however. The home market moved somewhat sideways last year. That’s not to say things were at a perfect equilibrium — frustrations abound on both the buyer and seller sides of the home equation. But it’s fair to say that as we begin 2026, there is more balance in the market, even as prices remain elevated. We will take a look at the year ahead, but first, a quick review of the data for 2025…
The Year That Was
There are several key researchers and aggregators of data that I follow, each of which has a slightly different methodology with regard to home prices and, therefore, will show modestly different results. But they all showed the same basic pattern in 2025: home prices are leveling off and even starting to fall, especially in certain markets. Consider the following:
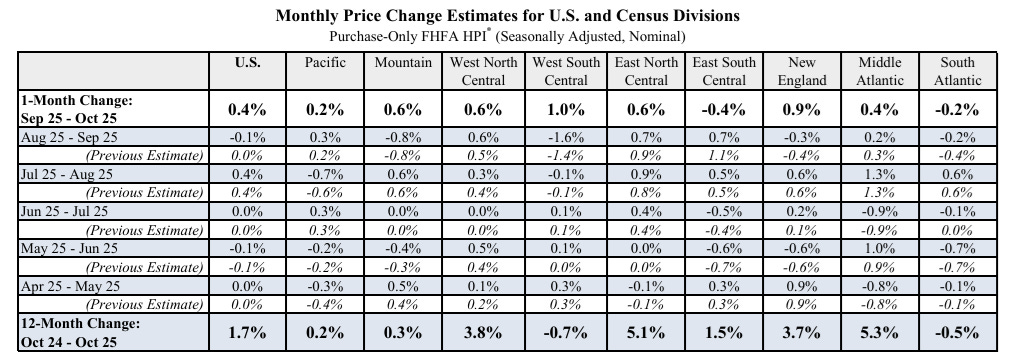
The Federal Housing Finance Agency found single-family home prices to be up 1.7% from October 2024 to October 2025 (the most recent month for which data is available). Price gains year-over-year (the bottom row of the chart below) were the most robust in the East North Central region (+5.1% — this includes Illinois, Indiana, Ohio, Michigan, and Wisconsin), and the Middle Atlantic (+5.3%). Home prices actually dropped year-over-year in the West South Central region (-0.7% — this includes Texas, Louisiana, Arkansas, and Oklahoma), and in the South Atlantic (-0.5%, which is largely dragged down by price drops in Florida).
The Case-Shiller Index calculated the data quite similarly, finding an increase in home prices nationwide of 1.36% from October 2024 to October 2025 (data is not available yet through the end-of-year).
Redfin calculates home prices up 0.7% in November year-over-year with the median home price at $433,261.
HousingWire, which is reporting data through the end of the year, shows prices up 0.2% in 2025 (i.e. essentially flat).
Data from the Federal Reserve showed the median home price at $410,800 in Q2 of 2025, down about 1% from the $414,500 price it saw in Q2 of 2024 (although down about 7% from a recent peak of $442,600 from Q2 of 2022). The chart below shows the median home price, per the Fed, going back to the early 1960s:
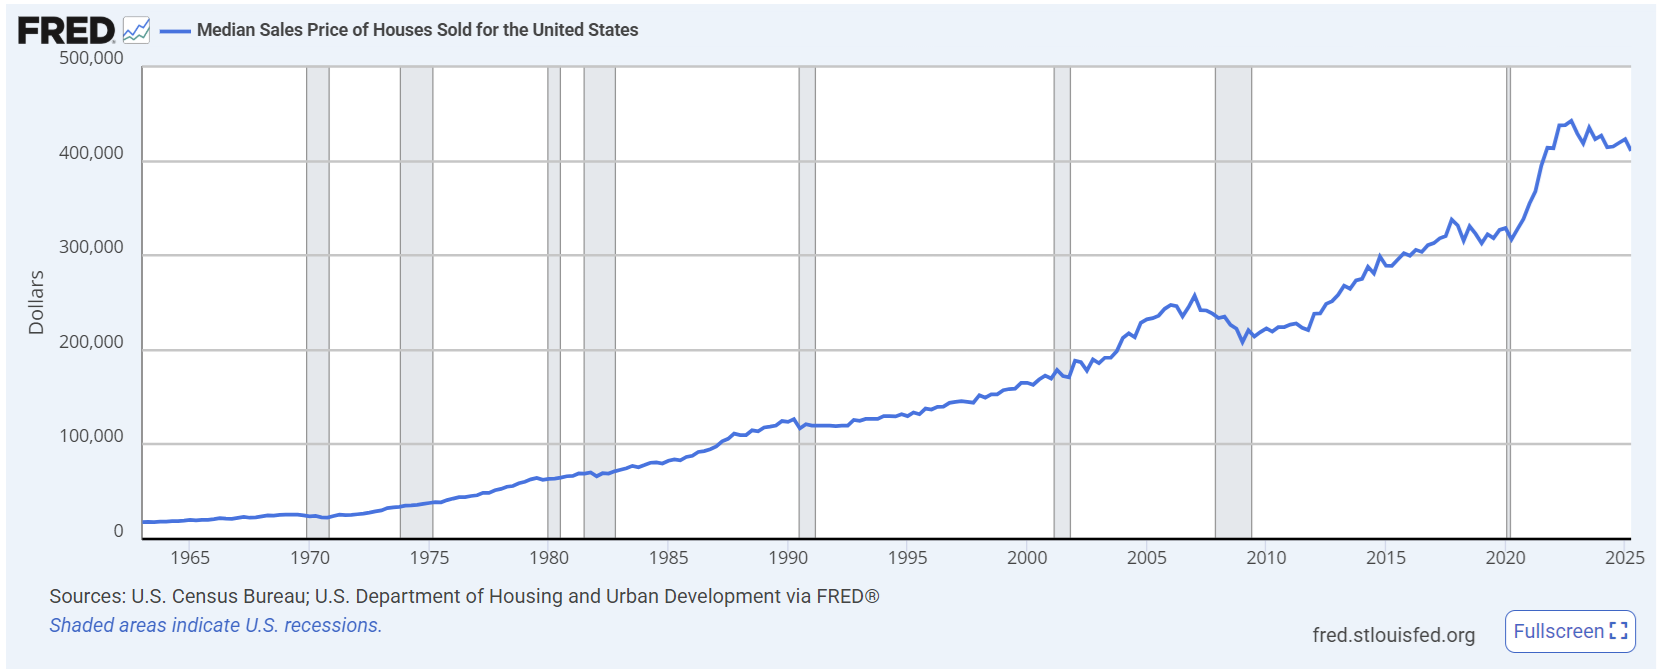
The big run-up in prices during the pandemic is evident above, as is the easing since. You can also see the drop in home prices during the 2008 financial crisis, which was quite major at the time, but seems pretty far in the rearview at this point.
Beyond prices, certain other metrics also show signs of normalizing. The inventory of active listings nationwide crested over the one million mark this past summer for the first time since December 2019. The Federal Reserve data below shows the number of listings going back ten years; note the interesting wavelike rise and fall in the data each year — this is the seasonality of listings, which typically increase in the spring and summer and then drop in the fall and winter:
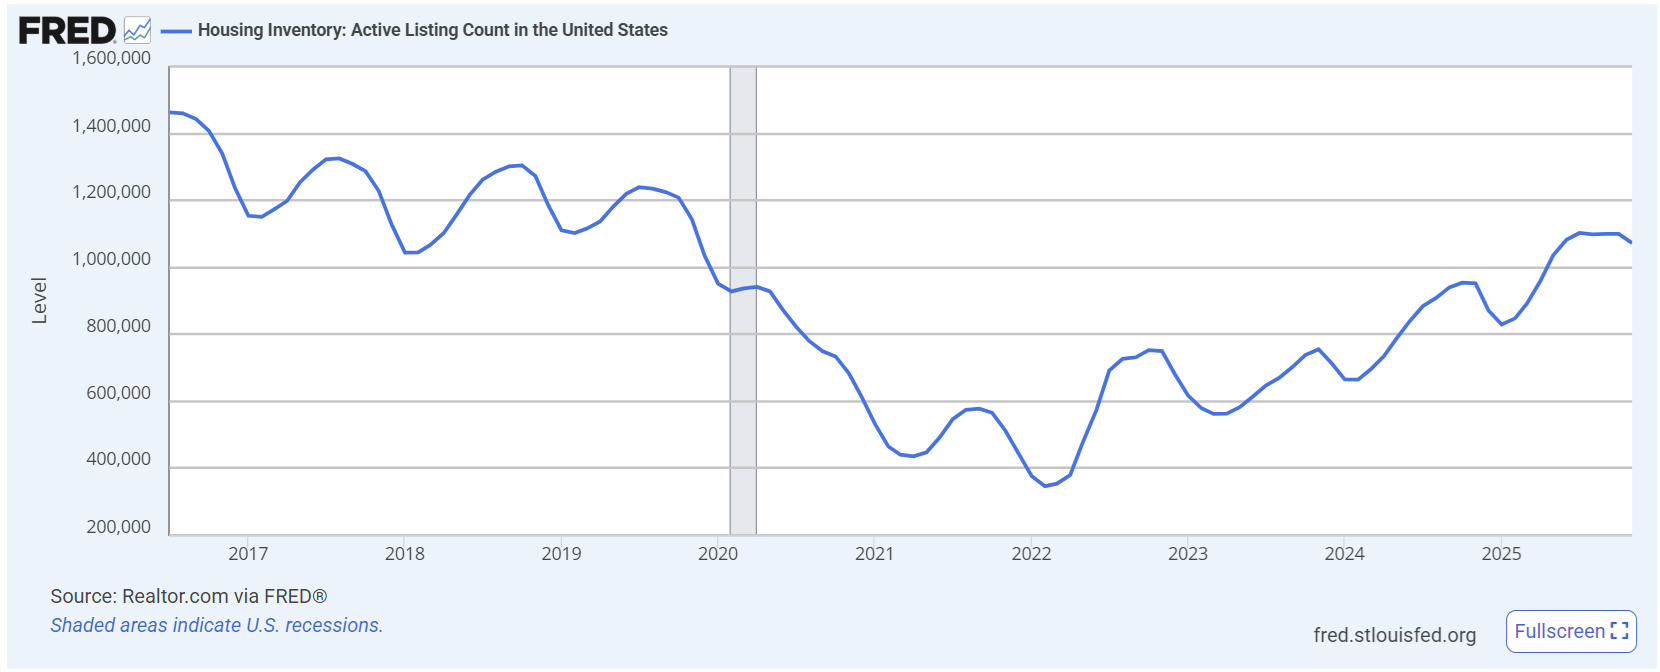
The November 2025 listing count of 1.07 million homes for sale is about 12.5% greater year-over-year than the 952,000 listings in November 2024. And while we are still below the number of active listings that were common to the market before the pandemic, the number of November 2025 listings was more than double the 512,000 listings the market saw in November 2021, which was near the low point.
With listings up, the number of transactions was also up for the year, although only modestly and perhaps not as much as you might think given a decline in mortgage rates. Per Zillow and Statista, the number of home sales in 2025 once all the data is aggregated was likely to have been in the 4.1-4.2 million range, a negligible increase over the 4.06 million transactions in 2024.
The Year Ahead
Housing is, of course, a unique “widget” to use an economics book term, but like any other widget you might analyze, home prices are still based on the basic principles of supply and demand. So let’s look at both.
First, on the supply side, the data above shows that the number of homes for sale is increasing. If the wave pattern in the chart above continues as normal in 2026 (which it almost certainly will), and continues to elevate out of the 2021-2022 overall trough, we could see close to 1.2 million homes for sale by the summer. That increased supply of inventory gives buyers more choices, and serves to help depress prices (or at least continue to take the top off the frenzy).
I believe this increase in supply represents a normalization of the market and a catch-up of all the listings that were meant to have taken place over the past few years, but didn’t. Let’s say the decision to buy or sell a home is basically on a bell curve where a “normal” number of Americans will choose to sell their homes each year just due to the variables of life (e.g. downsizing, upsizing, moving geographically, changing family dynamics, etc.). There has been a great artificial muzzle over this normal bell curve of behavior over the past five years, and that has been the interest rate lock-in effect (plus the low inventory, which has been part of a self-reinforcing cycle; low-inventory leads people to have fewer options, which induces them to stay put, thereby limiting the normal churn of inventory there should be in a healthy market). People have self-selected out of moving because 1) where are they going to go with so few choices on the market and 2) they don’t want to give up their pre-2023 interest rates, which are often 3% or better, to move into a market with higher prices, fewer choices, and higher rates. As such, there has been a great artificial (but rational) limitation on moves.
However, many of these variables continue to shake themselves out. Interest rates are lower (more on this below), inventory is climbing (as noted above), and the wheels of life just continue to turn. There has been pent-up demand to sell. If you believe, like I do, that over the past few years there have been several million moves that were meant to have happened on the normal bell curve of life but didn’t, well, a lot of these moves still need to happen and will over the next few years. This creates new demand in the market (more on the demand side below), but it also creates more supply of homes as people list their own properties in preparation for a move. Increased supply (even with a corresponding increase in demand), I believe, will lead to a further easing of prices as buyers have more options and sellers find themselves competing with one another to attract buyers rather than the other way around. If you’re selling a home and yours is the only one on the block for sale, you are more likely to get a higher price. If the house across the street from you is also for sale, that competition is going to limit how high you can go (assuming the homes are comparable).
What About Construction?
The other piece of the supply puzzle is new construction. From the perspective of a buyer looking for further normalization of the market and perhaps a reduction in home prices, the construction story as it pertains to prices is not quite as rosy as the discussion above about new listings.
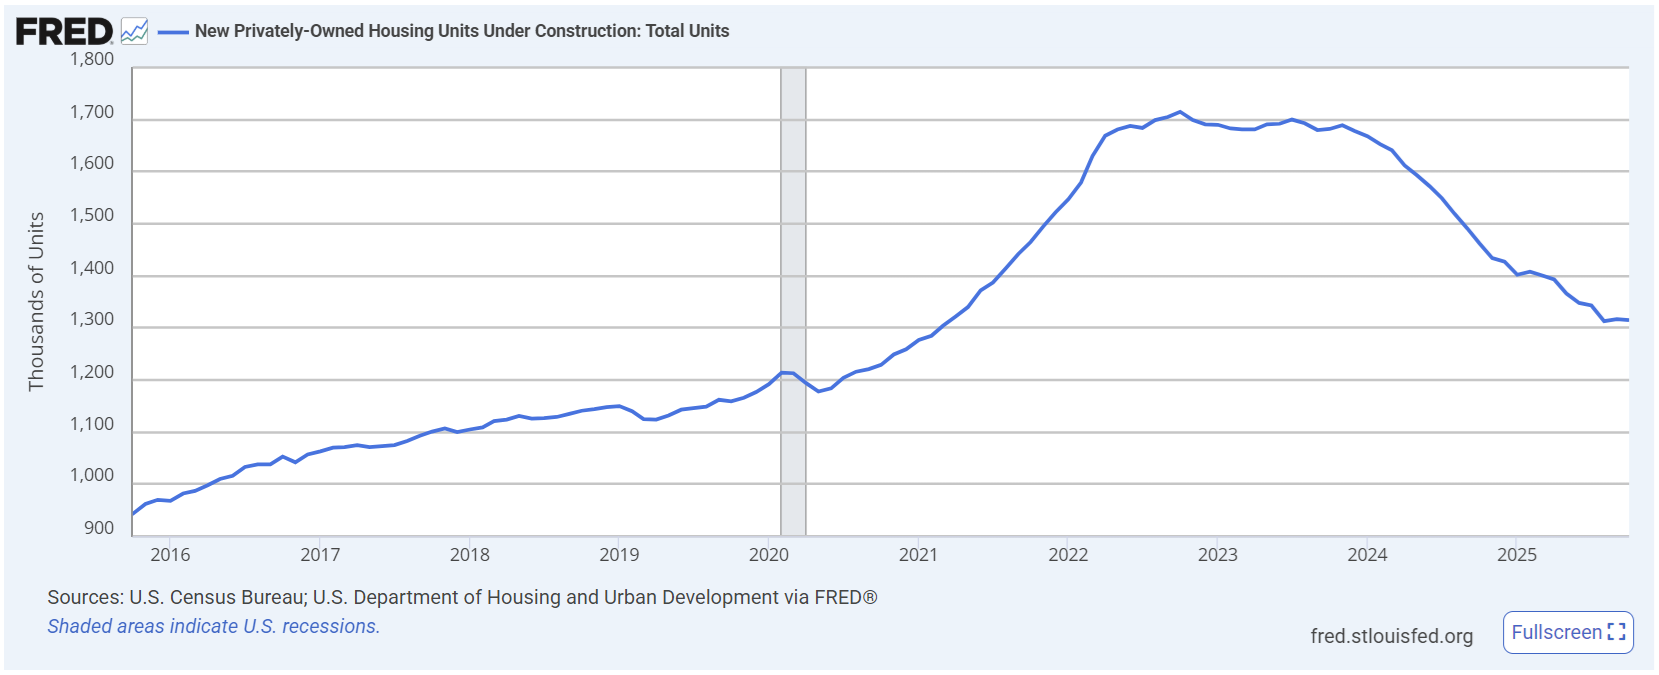
New construction of single-family homes has fallen off considerably over the past year. As of October, there were 1.3 million homes under construction (on an annualized, seasonally-adjusted basis), which was the lowest rate since March 2021. The number is down from 1.462 million in October 2024, a decline of about 10%, as shown in the chart below:
Why is new home construction slowing down? There are several reasons. First, costs have continued to rise. Although the rate of inflation in building materials has slowed down, costs are still about 40% higher than they were before the pandemic. Some items, like lumber, have normalized a bit and even declined. Others, like steel, aluminum, and electronic components, have continued to rise notably over the past 18 months. Rising costs have been a result of supply chain issues, tariffs, and global trade policies. The National Association of Homebuilders has estimated that tariffs add an average of $7,500-$10,000 to the cost of building a new single-family home.
Other costs to the builder have risen too, which then get baked into the price and passed along to the buyer. These include the higher cost of builders’ insurance, plus all the normal costs of engineering, permitting, and other local and state expenses associated with the approval process. As these costs continue to rise, it has a damping effect on new construction.
The labor shortage is a major part of this, too. The United States has an older workforce to begin with, with fewer young people choosing the trades (although I see anecdotal evidence of a swing back on this in my own community over the past few years, with technical high school course options rising in popularity). Many of these older workers are retiring, and there are just not enough people coming up behind them to meet the home construction needs of the country. With fewer workers, prices are going to be higher because the workers that are in the industry can command higher rates.
Immigration is a part of this, too. People don’t come to The Sunday Morning Post for politics, but the truth of the matter is that with less inbound migration to the United States, a crackdown on illegal immigration, and the fear that so many legal migrants are living with, which leads many to be less active in the workforce, the labor pool for construction has been significantly dampened. Just this past week, ICE detained four immigrant day-laborers from a Home Depot parking lot in Phoenix who were there looking for work, as is common in Home Depot parking lots around the country each morning. Situations like this are going to have a massive chilling effect on immigrant labor, which, for better or worse, is crucial to the U.S. construction industry, particularly in fields like roofing, drywall, and painting. Fewer immigrants means fewer workers, which means delays and higher prices.
Interest Rates
The interest rate question cuts to both the supply and demand sides of the equation. Builders, too, are subject to the same interest rate environment that buyers and sellers are. With rates rising from 2023 until the early part of 2025, the costs of financing construction were also higher, so less construction took place. Not coincidentally, the recent peak of new home construction was in October 2022, when over 1.7 million homes (on an annualized, seasonally-adjusted basis) were under construction. That was just before interest rates started to spike. Rates then remained particularly elevated for the next 12-18 months. With these elevated rates, construction slowed down considerably.
It is an unfortunate irony in the housing market that at the time when new construction was most sorely needed to help ease price pressures, it became that much more difficult to build due to the rising interest costs and all the other higher expenses noted above. That being said, Fed Chair Jerome Powell was asked and responded many times saying that the health of the housing market is the responsibility of Congress and others, not the Federal Reserve.
So what’s in store for interest rates in 2026? It’s hard to say. The rate story was a positive one for would-be buyers in 2025; the average 30-year fixed mortgage rate dropped from just over 7.00% at the beginning of the year to just over 6.00% by the end of it. This reduction made for thousands of dollars a year of savings for many homebuyers. The conventional wisdom is that rates will continue to ease downward in 2026. I think this will be true on the commercial side. I expect rates for businesses and for things like rental properties and other types of commercial real estate to come down by half a percentage point to a point over the next 12-18 months (more on the rental market in next week’s article).
The story is more complicated on the residential side, however. Traditional 15- and 30-year home loans are not subject exactly to what the Federal Reserve is doing with interest rates. The Fed can lower rates all it wants (and it may do so later this year with Chair Powell’s term running out and Trump, who has stated numerous times that he wants rates to be lower, choosing a successor who will likely be amenable to this), but home loan rates from banks and mortgage brokers are based on market forces of supply and demand and competitive pressures, but even more importantly, are based on the market’s expectations of future inflation. I have written about this before and probably will come back to it again soon as it is a complicated topic worthy of more exploration, but home loans are typically packaged by banks and sold to investors. If investors believe that rates will be higher in the future than they are now, they will demand greater yields from these mortgage-backed securities. That makes rates go up. And right now, although inflation has come down pretty significantly from its 2023 peaks, it hasn’t come down all the way, and there are still quite a few potential inflationary triggers out there, not least of which is who Trump picks to lead the Fed.
So What’s Ahead?
What I see in the housing market for 2026 is a continuation of the trends we saw in 2025: more listings, an easing off of prices, and a relatively flat number of transactions. The other key variable in these questions about the housing market (indeed, maybe the key variable) is the strength of the economy. One significant reason why home prices surged so much from 2020-2024 is that the unemployment rate was very low. People were working and the economy was relatively stable (despite the global turbulence of the pandemic). Stimulus programs and massive business relief programs helped bolster things, too.
But now, here at the beginning of a new year, Americans are feeling increasingly uncertain. I’ve mentioned tariffs and the uncertainty of global trade, but on top of that, there are massive unknowns with the rapid rise of AI and automation technology that could make entire career fields obsolete over the next few years. When people feel uncertain or unstable, they delay big life decisions including whether to buy a home or to move. The collective uncertainty out there is bound to have a dampening effect on transactions. On top of that, many people continue to struggle with prices at the grocery store, rising insurance and utility costs, and just the general expenses of life.
Crash?
One final note: you don’t hear a lot these days about a potential housing market collapse. I remember there being some talk of a housing bubble in the 2021-2022 timeframe, but there is scant reference to such a thing today. The typical American homeowner is in pretty good shape financially, especially those with pre-2023 mortgages. Delinquency rates are quite low. I’ll come back to this in a future article. While credit card debt is flashing some troubling and worrisome signals, mortgage debt by comparison is stable. I think this is a result of the fact that so many mortgages have attractive interest rates and the economy has been relatively strong despite the current uncertainty. Additionally, many of the tightened banking standards following the Great Recession have led to a more well-qualified pool of borrowers. Plus 40% of American homeowners don’t even have a mortgage, so that is a large portion of the homeowner pool that is not at risk of default.
Final Thoughts
So final predictions for 2026? I expect home prices nationwide to drop by 3-5%, and more in certain markets, especially in the south and southeast. I think the 30-year fixed rate will remain frustratingly elevated (although the current rate of just over 6.0% is not bad by historical standards). Listings will continue to increase, giving buyers more options. Buyers should remain patient, as I think the general environment only becomes more attractive for them over the next 12 months, even if rates do stay up. Sellers should be mindful that not only is the market more in balance now, but momentum is shifting notably to the buyer side. Sellers should be prepared to offer concessions on price, and be patient as homes are likely to sit on the market for longer.
Ben Sprague lives and works in Bangor, Maine as a Senior V.P./Commercial Lending Officer for Damariscotta-based First National Bank. He previously worked as an investment advisor and graduated from Harvard University in 2006. Ben can be reached at ben.sprague@thefirst.com or bsprague1@gmail.com. Thoughts and opinions here do not represent First National Bank.