
The Home Stretch of the 2025 Home Market


It’s hard to believe, but at the time of this writing, there are just 67 shopping days until Christmas, which means we are past the final quarter pole of 2025 and the horses are coming down the home stretch. With that in mind, I wanted to offer a basic temperature check on the housing market. A lot has happened this year. There has been movement in interest rates, the stock market has proven remarkably resilient even as people have developed increasingly uncertain feelings about the overall economy, and to top it all off, at the time of this writing, the government is shut down. There is an unsettled mood over things (to say the least) in the nation’s capital and beyond. What does it all mean? And what can we expect as we look towards 2026? Let’s dig in.
The State of the American Consumer
For better or worse, we are a consumer-driven economy. When employment is stable, wages are rising, and inflation is under control, people spend (particularly on big ticket items, including homes). When people spend, there is a multiplier effect through the entire economy. On the other hand, when people are feeling financially insecure, they tighten up, and the multiplier effect is much more muted. With regard to the housing market, interest rates and prices matter, for sure, but the overarching variable, as James Carville pointed out in 1992, is always the economy, stupid.
So let’s look at the numbers. The unemployment rate in August was 4.3%, which is up modestly from a January low of 4.0%, but still at a historically healthy level. Unemployment hasn’t been above 5% since August 2021. In the most recent labor report, slight gains are noted in the healthcare industry with losses in the government sector, attributable largely to federal layoffs (job losses from the current shutdown have not been reflected in the data yet; there are likely more job losses to come in this area). Employment was little changed in construction, retail, transportation, and various other sectors.
There are warning signs in the labor statistics, though, including ones I wrote about just recently. The youth unemployment rate among those ages 16-24 was 10.5% in August, which is the highest it has been since April 2021 (keep in mind this 10.5% is not 10.5% of all youth ages 16-24; it is actually 10.5% of the pool of youth who are actively working or looking for work. Sixteen-year-olds who are not working and don’t want to work, for example, are not part of the overall pool). The 10.5% rate is a little high, for sure, because it shows that one out of ten young people who want to work are unable to find jobs (or unwilling to accept the ones that are out there).
The unemployment rate for recent college graduates is 5.3%, which is above the overall unemployment rate of 4.3%. As I wrote about recently, the percentage of unemployed recent grads in the computer sciences and computer engineering majors stand at 6.1% and 7.5%, respectively, which is attributable largely to a rapidly changing job market in those fields due to AI effectively performing the tasks that so many computer science majors intended to do themselves.
Overall, here is how I see the health of the labor economy: stable by historical standards, but with some slight cracks in the foundation attributable to natural economic forces and cycles, but also because we are seeing the very beginning of AI job consolidation (read more from the recent archives here). I see the anecdotal statistic about the computer science majors as a bit of a canary in the coal mine with longer term implications for the labor market that are pretty ominous when you think about them.
Beyond Jobs
While stability of employment is the generally the top thing on people’s minds with regard to their overall feelings on the economy, there are other variables at play, too. First and foremost of these is inflation, which hasn’t quite been fully tamed. Although the August inflation rate of 2.9% is well-below the 2022 and 2023 peaks and within shouting distance of the Fed’s targeted inflation rate of 2.0%, the August reading was the highest since January. Inflation had been running at 2.3% in April, so we are going in the wrong direction just a bit. Of particular pain to people: food inflation (3.2%), rent inflation (3.6%), and services inflation (3.8%) are all running hotter than the inflation rate overall.
On top of that, there is the non-quantifiable “vibes” of it all, by which I mean it seems like so many Americans on both sides of the political spectrum feel that things are just not quite right these days (with certain things that are really not right). Is that overarching angst leading people to tighten up economically? I think so (although, to be sure, prices at the grocery store and for many other items and services are not just vibes — they are the stuff of trying to get by, which is hard for a lot of people right now).
According to the University of Michigan consumer sentiment survey, year-over-year sentiment has dropped by 22% since last October, with “pocketbook issues like high prices and weakening job prospects remain at the forefront of consumers’ minds,” per the report. That being said, sentiment is up slightly since the April 2025 lows for the year, which suggests some stabilization. But people are generally feeling dour in the last half of 2025 as compared to how they felt in 2024.
Interest Rates
The decision by the Federal Reserve to lower interest rates in September had been long awaited as a possible sign that certain logjams in the housing market might break. However, home loan rates do not necessarily move in exact accordance with what the Federal Reserve is doing.
And yet, good news! Home loan rates are continuing to drop. There was a surprising jog upward in September immediately on the heels of the Fed’s rate announcement, but then, as you can see in the chart below, the average 30-year home mortgage rate has since resumed its overarching trend downward. The chart below shows the average 30-year mortgage rate over the past three years from the October 2023 peaks near 8.00% to rates as of this week around 6.3%.
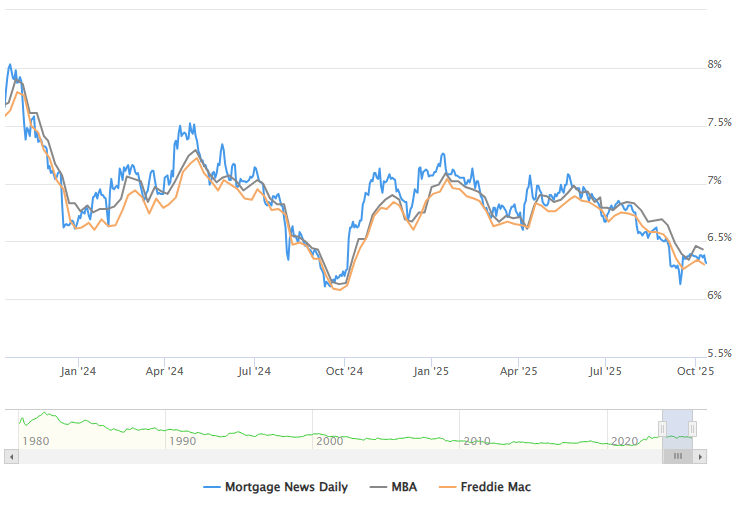
That drop is welcome relief to many buyers and would-be homeowners. The estimated monthly payment on a $400,000 mortgage with a 30-year fixed rate of 8.00% would be $2,936/month. But at a 6.3% rate? The monthly payment would drop to $2,448, a difference of nearly $500/month, or $6,000/year. That is real money!
With the above math in mind, falling interest rates should boost demand for homes by bringing stubborn, reticent, or mathematically savvy and patient buyers back from the sidelines. It would be fair to wonder, however, if a reduction in interest rates will lead to a spike in home prices, which would thereby negate much of the benefit to the buyer of the lower rates. After all, if lower rates do stimulate demand, and if there are more buyers in the market, it might theoretically lead to higher prices; this is a basic principle of supply-and-demand.
But there are other variables at play, too, including the discussion above about the general economic uncertainty that is out there. People typically delay big life decisions (such as the purchase of a home) if they are not confident about the economy (either on the macro-level or in the micro-level of their own household situation). So as long as consumer sentiment is fairly weak, home prices might stay at least at their current levels, if not modestly drop (even with a downtick in interest rates).
And to that point, there is no evidence yet that the decline in home mortgage rates in 2025 has led to a corresponding increase in home prices. In fact, there is evidence that home prices are starting to fall even as rates have come down throughout 2025, which suggests the intuitive relationship between supply and demand with regard to home prices might not hold in the current market (although different geographic areas and types of homes will vary; it’s impossible to paint something as complex as the market for homes with broad brushes).
Don’t Forget About Supply
The other reason why a decline in rates has not necessarily led to an increase in prices (and may not in the immediate future) is related to the supply side of the equation, which is much different today than it was during the roaring housing market of 2021-2023. There are a couple of different aspects to this. First, new single-family home construction has steadily increased in output over the past 15 years. The chart below shows completed new single-family units (annualized and seasonally adjusted) going back 15 years:
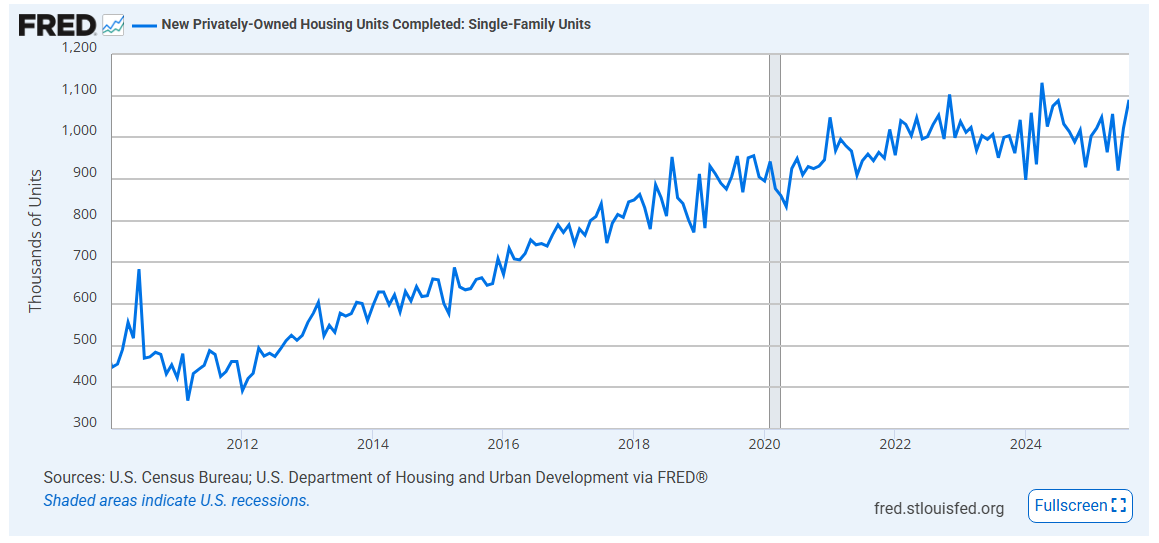
The rate of 1.09 million new housing units coming online (on an annualized basis) in August 2025 is near the peak of new construction going back to the aftermath of the Great Recession. As all of these newly constructed units have hit the marketplace (especially over the past 4-5 years), it has loosened the supply side of the equation, which, I believe, has led to a deceleration in home prices and, in many markets, the start of price reductions. With more new homes available, buyers have more options, which has dampened price pressures.
The second aspect of supply is of existing homes for sale. The chart above shows newly constructed homes, but the data on existing homes is interesting to look at, too. In September, per the National Association of Realtors, there were just over 1.1 million homes for sale. That is actually the most homes for sale at any one time since November 2019. You can see on the chart below the seasonality of listings, which drop towards the end of year and then increase in the spring:
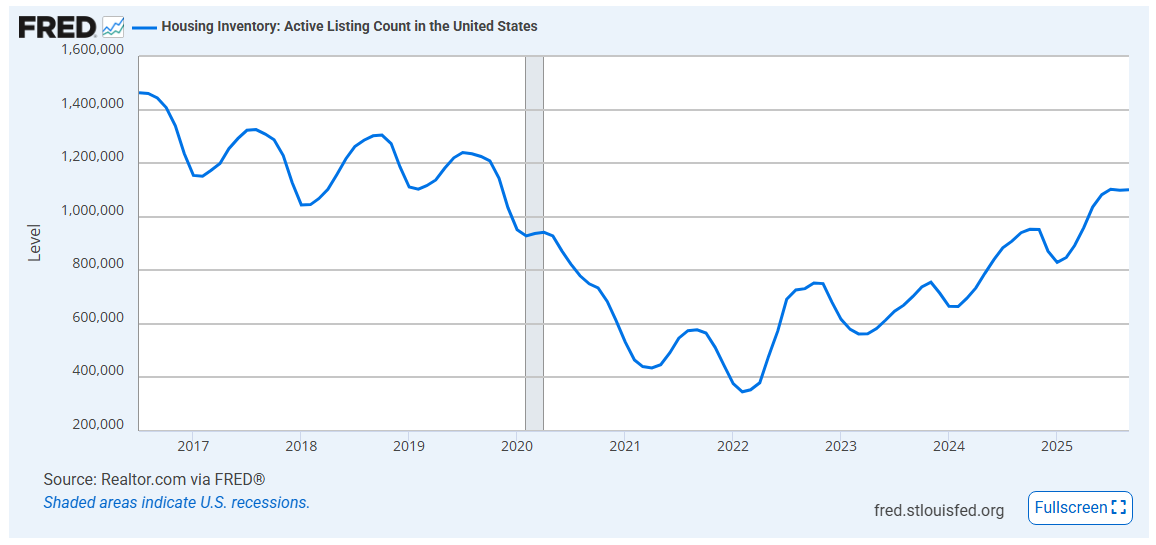
You can also observe in the chart above how low the listing count was in 2021-2022. This is attributable to two factors. First, the world was frozen during the pandemic. As discussed above, people don’t make major life decisions when they are feeling economically uncertain. And second, there was an interest-rate lock-in effect where people were not willing to give up 3% or better mortgages to move into a market with rapidly rising prices. We are still dealing with this lock-in effect today and, indeed, will be for the next 20+ years, as people will just not want to budge from those pre-2023 mortgages. It’s a critical variable to understand when analyzing the housing market.
But life happens — people move, families change, geographic preferences evolve. I think what we are seeing now with the increase in new listings is all of that pent-up demand among sellers is coming to the fore, and the logjam is breaking a bit.
A Quick Note on Prices
It feels hard to write about home prices sometimes because there are several different key indexes that track this data, and they sometimes report different things. There is also a lot of regional variability. Here in Maine, for example, home prices are up only about 2% year-over-year through August. This just about matches the nationwide data from Redfin, which has prices up 1.8% through September. Home prices appear to be the most robust in the Northeast and Midwest, with prices starting to drop in parts of the South and West. I plan to come back to the topic of regional variability in a future article. No matter what metric you look at, though, it is clear that home price growth has decelerated, which I attribute to the general sense of economic uncertainty out there, and to a more patient buyer pool.
The Shutdown
It’s hard to tell how long the current federal shutdown will last, and it’s easy for some outside the Beltway to say it is not really impacting that much. But for a lot of pending homebuyers and others in the real estate world, there are some very real impacts. Properties that are in flood zones, for example, may not be able to be transacted if buyers cannot obtain flood coverage through the federal National Flood Insurance Program. Others who are using loan programs connected with the USDA or other federal programs that support first-time homebuyers are suddenly stuck. Closings could be delayed that are using Fannie Mae or Freddie Mac. Hopefully the government reopens soon so that people dealing with the stress of trying to buy or sell a property at this moment in time can resume their processes.
What I Am Seeing
This is just anecdotal, and keep in mind that I work as a commercial lender and not a residential one, but what I am seeing is that homes are definitely staying on the market for longer. There is strong demand for lower and middle-priced homes. There is also still decent demand for unique homes in the upper price tier. But if I had to pinpoint a spot on the price spectrum that is a bit challenged right now, it would be the low end of the upper tier. These homes are often newly constructed and are priced high to account for the high cost of building (e.g. labor, materials, etc.). But the demand is weak at those price points right now, so some of them are just sitting on the market. The leverage has flipped from sellers to buyers over the last year, and buyers are now more patient and selective.
One final comment on rental properties — the focus of today’s article has been on the single-family home market, but some of the dynamics at play there are relevant in the rental market as well. I have seen a lot of new construction over the past 5-7 years, which has boosted the supply (although, to be sure, there are many markets that could use significant new construction still). Prices haven’t come down much on rental properties that are being sold, and commercial interest rates are still fairly high. When you consider that insurance, property taxes, and other costs of ownership are high too, the math remains tough on new rental acquisitions. We’ll see if any of that eases as we head towards 2026.
Ben Sprague lives and works in Bangor, Maine as a Senior V.P./Commercial Lending Officer for Damariscotta-based First National Bank. He previously worked as an investment advisor and graduated from Harvard University in 2006. Ben can be reached at ben.sprague@thefirst.com or bsprague1@gmail.com.