
Who Had it Worse? Early 1980s vs. Mid-2020's.
But with a barrier-to-entry caveat.


Because I research and write about housing and the economy pretty regularly, the algorithms constantly feed me content about these topics, and a meme I chuckle at every single time it hits my feed is a video of a group of 70-year-olds dancing on a cruise ship with the caption, “How Boomers feel selling their homes for $2 million after buying them in 1969 for 11 raspberries.” I can just hear my favorite Boomer readers harrumphing in response, “Well, maybe if young people today didn’t stop at Dunkin Donuts every day on their way to work, it wouldn’t be so hard to pay a mortgage.
As an Elder Millennial myself, I hope my Boomer friends and family will appreciate that my generation is fast becoming the target of the younger generations’ meme game. I was described recently as being “from the 1900s,” which is an equally sharp and amusing jab as the “Okay Boomer” meme that was popular a few years ago, or the 11 raspberries joke from today.
But I digress. The question of how hard it is to buy a home is one of the most common sources of intergenerational friction. Several years ago, I wrote an article comparing what it was like to buy a home in 2023 as compared to 1983. This was in response to people pushing back on the complaints of the younger generation by pointing out that when they themselves got started a generation or two ago, interest rates were much higher than they are today. So while today’s problems in the housing market are significant, they look different, and people buying homes in the 1970s and 80s had their share of challenges, too.
What I concluded in the 2023 article was that the two time periods actually have a lot of comparisons:
The average monthly mortgage payment today is only slightly higher than the average monthly mortgage payment in 1983, adjusted for inflation, even though home prices are a lot higher. And mortgage payments today as a percentage of individual income are exactly the same…
But the question of prices is a major one: remember, home prices are almost double today what they were in 1983, adjusted for inflation. This presents a high hurdle for younger homebuyers, those who are just getting started out, or traditionally underrepresented demographics in the home buying market, all of whom may not have had the time and opportunity to build up a nest-egg for a 10-20% down payment or to cover the ongoing costs associated with owning a home.
The general takeaway from the above (from the vantage point of 2023), is that in terms of Americans’ monthly cash flow, a mortgage payment in 2023 had a very similar impact to individual and family budgets as it did in 1983, but the hurdle for those just getting started out was greater in 2023 than it was forty years earlier.
I thought it would be worth a look at the analysis to see what, if anything, has changed since 2023.
The Key Variables
To get a clear look at this question, you have to look at three distinct variables. The price of homes (adjusted for inflation) is just one of them. The others are interest rates and incomes. Let’s start with prices.
Prices
The median home price today per the National Association of Realtors is about $408,800. In 2023, it was actually $416,100, so there has already been a move to the good for buyers in the past three years. When you consider that most goods and services have increased in price over the past three years, the fact that home prices have not is actually quite notable.
What about the early 1980s? I’m going to stick with looking at 1983 as it’s a fair anchor for defining “the early 1980s.” If I was picking the absolute peak moment of interest rates, it would skew the analysis (it would be October 1981, by the way). I’m going to stick with 1983 as a kind of an average, typical year in this time period we are looking at.
In 1983, the median home price was $74,900. Using the Bureau of Labor Statistics calculator to compare dollar amounts from different time periods, $408,800 today would be the equivalent of about $122,000 in 1983. Looking at the reverse calculation, the median home price of $74,900 in 1983 would be equivalent to about $253,000 today. It’s therefore about 60% more expensive to buy the median home today than it was in 1983, and this is adjusted for inflation. Score one for the would-be homebuyers of today in their case that things are more challenging here in 2026.
Interest Rates
On interest rates, I always enjoy sharing the following chart, which shows the history of the 30-year fixed rate mortgage going back over 50 years:
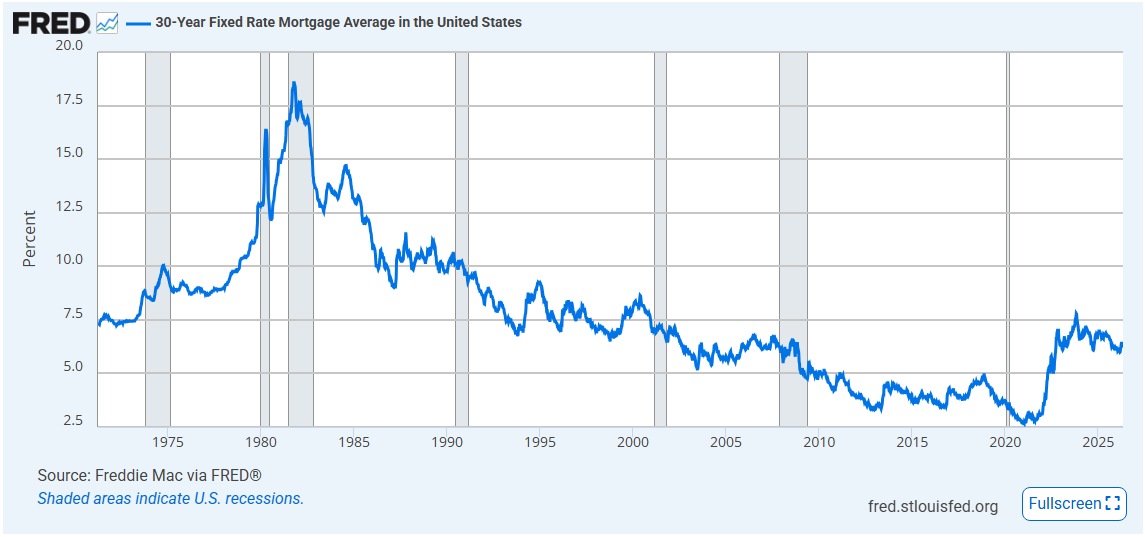
What a story that chart tells, from the huge surge in rates (peaking above 18% in 1981!) to the steady decline in rates over the course of the nearly 40 years that followed. If you want a fun trivia question to impress your nerdy friends who are into real estate, you can ask the question of what month represented the historical low for the 30-year fixed rate mortgage. The answer: January 2021, when the average 30-year rate hit 2.65%. I thank my blessed stars regularly that my wife and I closed on the home we live in now in July 2020, when rates were pretty close to the bottom, a lucky break of timing I wrote about a few years ago in a piece entitled, Dumb Luck and Golden Handcuffs.
Today the average 30-year fixed rate is 6.30%. So if you’re looking just at rates, things are far better today than they were in the early 1980s. In fact, here’s another trivia question that only a Sunday Morning Post reader might enjoy: following the early-1980s interest rate peak of rates being close to 19%, when did rates actually get as low as 6.30% again? Answer: not until the summer of 2002! People think rates are high today, and they are high relative to the recent 2020-2022 trough, but rates were higher than they are today for the entirety of the 1980s and 1990s.
Combining Prices and Incomes
If we combine the median home prices and the average interest rates in each time period, we can calculate the average monthly payment on a 30-year mortgage for each era and then adjust them for inflation, ending up with two figures that can stand up against one another.
First, using the 1983 numbers, the median home price of $74,900 with a 10% down payment results in a loan amount of $67,410. Using a loan calculator, the monthly payment on that amount on a 30-year fixed mortgage with a rate of 13.8% (the mid-year average rate in 1983), would have been $788/month.
Now, looking at today: the April 2026 median home price of $408,800 with a 10% down payment results in a loan amount of $367,920. Applying the current average interest rate of 6.30% generates a monthly payment on a 30-year mortgage of $2,277/month.
Comparing the two figures using an inflation calculator, $788 in August 1983 would be equivalent to $2,597 today. Looking at the reverse calculation, $2,277 in today’s dollars would be equivalent to $691 in 1983. It might take staring at these two numbers for a minute to figure out how they compare, but the conclusion here is that things were actually harder in the mid-1980s than they are today, with a larger average monthly payment for a typical mortgage in 1983 as compared to today.
But there is still one key variable to look at.
Incomes
The third variable that is necessary to include, and the one that is often missed when comparing prices across time periods, is incomes. According to the Bureau of Labor Statistics, the median weekly earnings nationwide in the first quarter of 2026 was $1,235/week. That works out to a median yearly income of $64,220, sweeping away regional differences and discrepancies between male and female and different rates and educational backgrounds (more on that below, though). The average mortgage payment for a median home today at an average interest rate of 6.3% is $2,277, or $27,324/year, which represents 42.5% of the average income.
Now, looking at 1983: the average weekly earnings in 1983 was $309/week, which totals to $16,068 for the year. The average monthly mortgage payment of $788 in 1983 represents $9,456/year, which is 58.9% of the average annual income in that time. Comparing the 42.5% of today’s income for the average mortgage payment with the 58.9% of average income from 1983 suggests that the more challenging period of time to buy a house and carry a mortgage was, indeed, the early 1980s, when a greater share of one’s personal income was going towards mortgage payments than it does today.
Considerations and Caveats
I chose to compare against the early 1980s because it is the time period people most commonly think of as being especially challenging for the homebuyer market. Other time periods would undoubtedly illustrate different conclusions. For example, let’s look at the math for twenty years ago, in 1996. The median home price in the second quarter of 1996 was $139,900, and the average 30-year rate was right around 8.00%. Using a loan calculator for 90% of the purchase price ($125,910) at an 8.00% interest rate generates a monthly payment of $924/month. This would be equivalent to $1,948/month today, so over $300/month lower in today’s dollars than it would be now.
That particular snapshot suggests that it is notably more challenging today than it was in 1996. Except on the income front, the average weekly wage in 1996 was about $486/week, or $25,272/year. A $924/month mortgage payment would have been $11,088/year in 1996, or 43.8% of average income. That is very comparable with today’s figure of average mortgage payments representing 42.5% of median income.
It is important to keep in mind that statistics reporting median metrics are just that: medians. If my math is correct, there are approximately 50% of working Americans making less than the median, and 50% making more than the median (that’s a little math humor for you). And things are, needless to say, considerably harder for those who make less.
And this is where the stress is most felt. For starters, saving 10-20% for a down payment is particularly challenging for those just getting started out. This is definitely an aspect of the current housing market that is significantly more burdensome than it was in 1983. Keep in mind the analysis above was mostly about cash flow and what portion of income goes towards a mortgage. But the barrier to entry is much more challenging today because home prices are so much higher, even when adjusted for inflation. The median home price in 1983 of $74,900 would be equal to $253,000 today. But the average median home price today is actually much more than that: $408,800. That means would-be homebuyers need to be able to bring more to the table today than they did in the early 1980s, even adjusted for inflation, and for many people, that is just an impossibility.
Consider, too, that income statistics are much more complicated than just reporting the median. That same BLS report referenced above showing today’s median weekly wage of $1,235/week is the number for all working Americans. For women, however, the median wage is $1,098/week. For Hispanic workers (male and female combined), it is $984/week. For Black men, it is $1,016/week, and for Black women, it is $956/week. If you were to do the full analysis above with a Black women’s median wage of $956/week, it represents an annual income of $49,712. The median monthly mortgage payment over a year of $27,324 would represent 55.0% of income. However, a caveat upon a caveat to consider is that female and minority wages were undoubtedly also lower than the overall median income in 1983, and probably even more so, so even though things are harder for those groups today, they were also harder back then.
It’s also worth taking a look at young people. The average median wage for young men and women age 16-24 is $812/week and $723/week, respectively. I’ll spare you the math, but the portion of a median home purchase at those income levels represents 65-70% of young people’s paychecks, which makes homeownership very difficult to say the least. (I know very few 16- and 17-year-olds are buying homes, but that’s the lowest age bracket of weekly wages the BLS reports; I’d rather see the numbers for those age 21-30, but that data doesn’t really exist in the same format. So it’s not exactly a fair statistic, but I still felt it was worth noting).
Final Thoughts
Barrier of entry concerns aside, that it was, perhaps, more challenging to pay a monthly mortgage in 1983 as compared to 2026 may feel disheartening to the modern generation, who generally feel like they have it pretty tough. One silver lining is that my previous 1983 vs. 2023 analysis, which I wrote in August 2023 and which you can read here, showed that average mortgage payments as a percentage of incomes were almost exactly the same in 2023 as they were in 1983. This means that things were harder for homebuyers just three short years ago than they are today. Things have gotten better! That should be a sign of hope for beleaguered buyers.
Things might get even better for buyers if interest rates continue to come down and if home prices continue to ease. The 2023 analysis showed challenges for buyers relative to today because the average interest rate in August 2023 and the one I used in that previous analysis was 7.2%, and the median home price was $416,100. Both of those numbers have moved to the good (6.3% and $408,800 today, as noted above), which has resulted in a more positive homebuying market. Incomes have also improved, albeit modestly, from 2023 to today.
Another reason to believe things are actually better today relative to 1983 is that, generally speaking, homes are nicer today. They are larger, more energy efficient, and typically have more amenities. This is part of the problem, some might fairly say, as not everyone wants a larger home with greater amenities. Countless buyers would much prefer a smaller home for $253,000 (the equivalent dollar amount today to the 1983 median home price), but that type of home simply doesn’t commonly exist on the market these days, particularly in higher-priced areas of the country. That is a policy problem as much as it is a financial one, as it is just too hard (and not profitable enough) for builders to construct starter homes that can be sold in the $200,000-$300,000 range. There are not enough homes being built to accommodate buyer demand in this price band, particularly from young people and others who have been historically underrepresented in the homebuying pool.
The other big consideration that is worth its own article at some point is to compare the carrying costs of home ownership today versus other time periods. I suspect property taxes and insurance have gone up considerably relative to inflation (especially insurance). However, there are likely some other areas of homeownership that cost less, like the cost of appliances and other fixtures, which have generally come down in price over time, adjusted for inflation. A final consideration is that the general “cost of life” is higher now, as there wasn’t anybody paying a monthly internet bill in 1983, for example, but today having internet (and having to pay for it) is essentially a requirement for life.
Lastly, another difficult thing to quantify is how tastes have changed over time. I would like to research this topic further, as it comes up from time to time from readers. Do homebuyers today have more demands, even if said demands are beyond what their budget should reasonably entail? It’s possible, although I still think the primary problem is a lack of inventory at all price points, and that buyers are generally pretty rational, even if expectations have crept up over time even if incomes and budgets, adjusted for inflation, have not.
To close, however, and to reiterate a point above, the real stress in the housing market is in the low and middle tiers of the spectrum. The main challenge is this barrier of entry issue, where home prices have risen in value so far beyond what the typical person who makes less than the median income can afford. To improve that reality for millions of Americans, home prices have to fall or incomes have to rise more substantially than they have over the course of time, and lower interest rates certainly wouldn’t hurt either, even if they are relatively low at the moment, historically speaking.
Ben Sprague lives and works in Bangor, Maine as a Senior V.P./Commercial Lending Officer for Damariscotta-based First National Bank. He previously worked as an investment advisor and graduated from Harvard University in 2006. Ben can be reached at ben.sprague@thefirst.com or bsprague1@gmail.com. Thoughts and opinions here do not represent First National Bank.
Ben, there are so many numbers! I feel like the homes today that I see on the market are the ´averages’ rather than the ´medians ’. If my read from Google is correct then the average today is $100,000 to $150,000 more than the median. Looking at a Zillow map of home prices in most desirable places to live , it looks like way more than half are well over $400,000 with $600,000 being a typical lower-end price.
Ben, a very complete analysis of how the relevant factors in the cost of home buying have changed in recent years.
There are other factors that separate the experience of the the baby boomers from today’s generation. Most boomers didn’t enter the job market deeply in debt. Too many young people today start off in debt with less available to save for a down payment on a house
The economy was a mess when the Baby Boomers entered the job market in the 70’s. We had ‘Stagflation’; high inflation and a weak economy. The degree of pain was measured by the ‘Misery Index’ adding the inflation rate and unemployment rate.
In December 1970 the Misery Index was 12.67%, on my graduation in June 1973 it was close to 12%, and by June of 1980 it reached the high point of 21.98%. As of March 2026 it was 7.56%.
https://inflationdata.com/articles/misery-index/
I closed on the purchase of my house in Brewer in May 1980. I had a first mortgage at 8.5% and a second mortgage at 14.5%.
Fortunately the 1980’s swept in a turn-around in American public policy. There was a dramatic increase in productivity and prosperity for the next 40 years. These decades gave boomers decades to get their finances stabilized and prepare for retirement.
The advise that helped me was:
1. It isn’t how much you make, it’s what you do it.
2. Live on one income and save the other one.
3. Save the downpayment before you have children.
4. Always spend less than you earn.