
The Home Price Pressure Valve Releases....Slightly
And a look at the data for how low home prices can go


Two weeks ago, I wrote about the plight of Gen Z, who are entering their peak homebuying years at a most disadvantageous time. Today, however, I want to offer some words of optimism for those frustrated, pent-up, would-be buyers (of all ages, really): the data suggests that the market for homes will be more attractive to buyers six months from now, 12 months from now, and possible even 24 months from now, than it is today. Patience will pay off. There is potential in certain markets, in particular, that the market will actually be much better on the buyer side in the months and years ahead. This should be something that would-be sellers should keep in mind, too, as it is important to time a sale correctly, at least as life circumstances and other variables allow.
So what does the data show? First off, nationwide, home prices are starting to ease downward. Per the U.S. Census Bureau and the U.S. Department of Housing and Urban Development, the median sale price for existing home sales nationwide has declined from a peak of $442,600 in Q2 of 2022 to $416,900 in Q1 of 2025. While that drop of nearly 6% is not overly substantial, given the near-constant run-up in prices over the past 20 years and the big jump during the pandemic, an easing off is notable. The chart below shows the last ten years of data, with the inflection downward evident over the past two years:

Other data sources show more mixed results, although the overarching trend between all of them is that prices are decelerating or modestly dropping. Bill McBride wrote in his CalculatedRisk Blog this past week that the Freddie Mac House Price Index was still up modestly year-over-year, but down very slightly month-over-month from March to April. The Case Shiller Home Price Index is still showing prices are up for the year, but a turn is becoming evident in that metric, as well, and as more data is released in the coming weeks, the Case Shiller Index is likely to correlate with the others.
McBride noted that 26 of 50 states plus Washington D.C. are showing prices below their previous peaks, with the “largest seasonally adjusted declines from the recent peaks in D.C. (-5.3), Colorado (-2.4%), Oregon (-2.0%), Montana (-1.7%) and Florida (-1.7%).” Prices in Austin, Texas are down nearly 14%, and curiously enough, four of the top five drops after Austin are all in Florida, with Punta Gorda and Fort Myers both showing double digit drops of just over 11% from their previous peaks.
Why are home prices starting to drop? There are several key variables:
Buyers are staying on the sidelines. Frustrated by high interest rates and high prices, many are sitting it out and waiting for something in the market to give. With fewer buyers, it has lessened the frenzy and dampened the upward price pressure.
The math is just too tough. Fewer would-be buyers qualify for financing with mortgage payments as high as they are (see above: something has got to give). Some while some buyers are choosing to sit out, others simply do not qualify for a purchase in this market.
A fair amount of new homes built over the past few years have come to market, which has added some much-needed inventory to the pool. As inventory rises, prices ease. This is particularly true in places like Austin, Texas, where new construction in both homes and rental units has been robust.
People are anxious about the economy. When people are feeling economically insecure or worried, they hold off on major life decisions and big purchases.
How Low Could Home Prices Drop?
Before considering what a home price drop could look like, it’s important to keep in mind that, over the long haul, homes have nearly always been a good investment. The overarching trend that supersedes all of the smaller mini-trends is that home values typically rise over time. Consider the chart below of the median home price in the United States going back to the early 1960s:
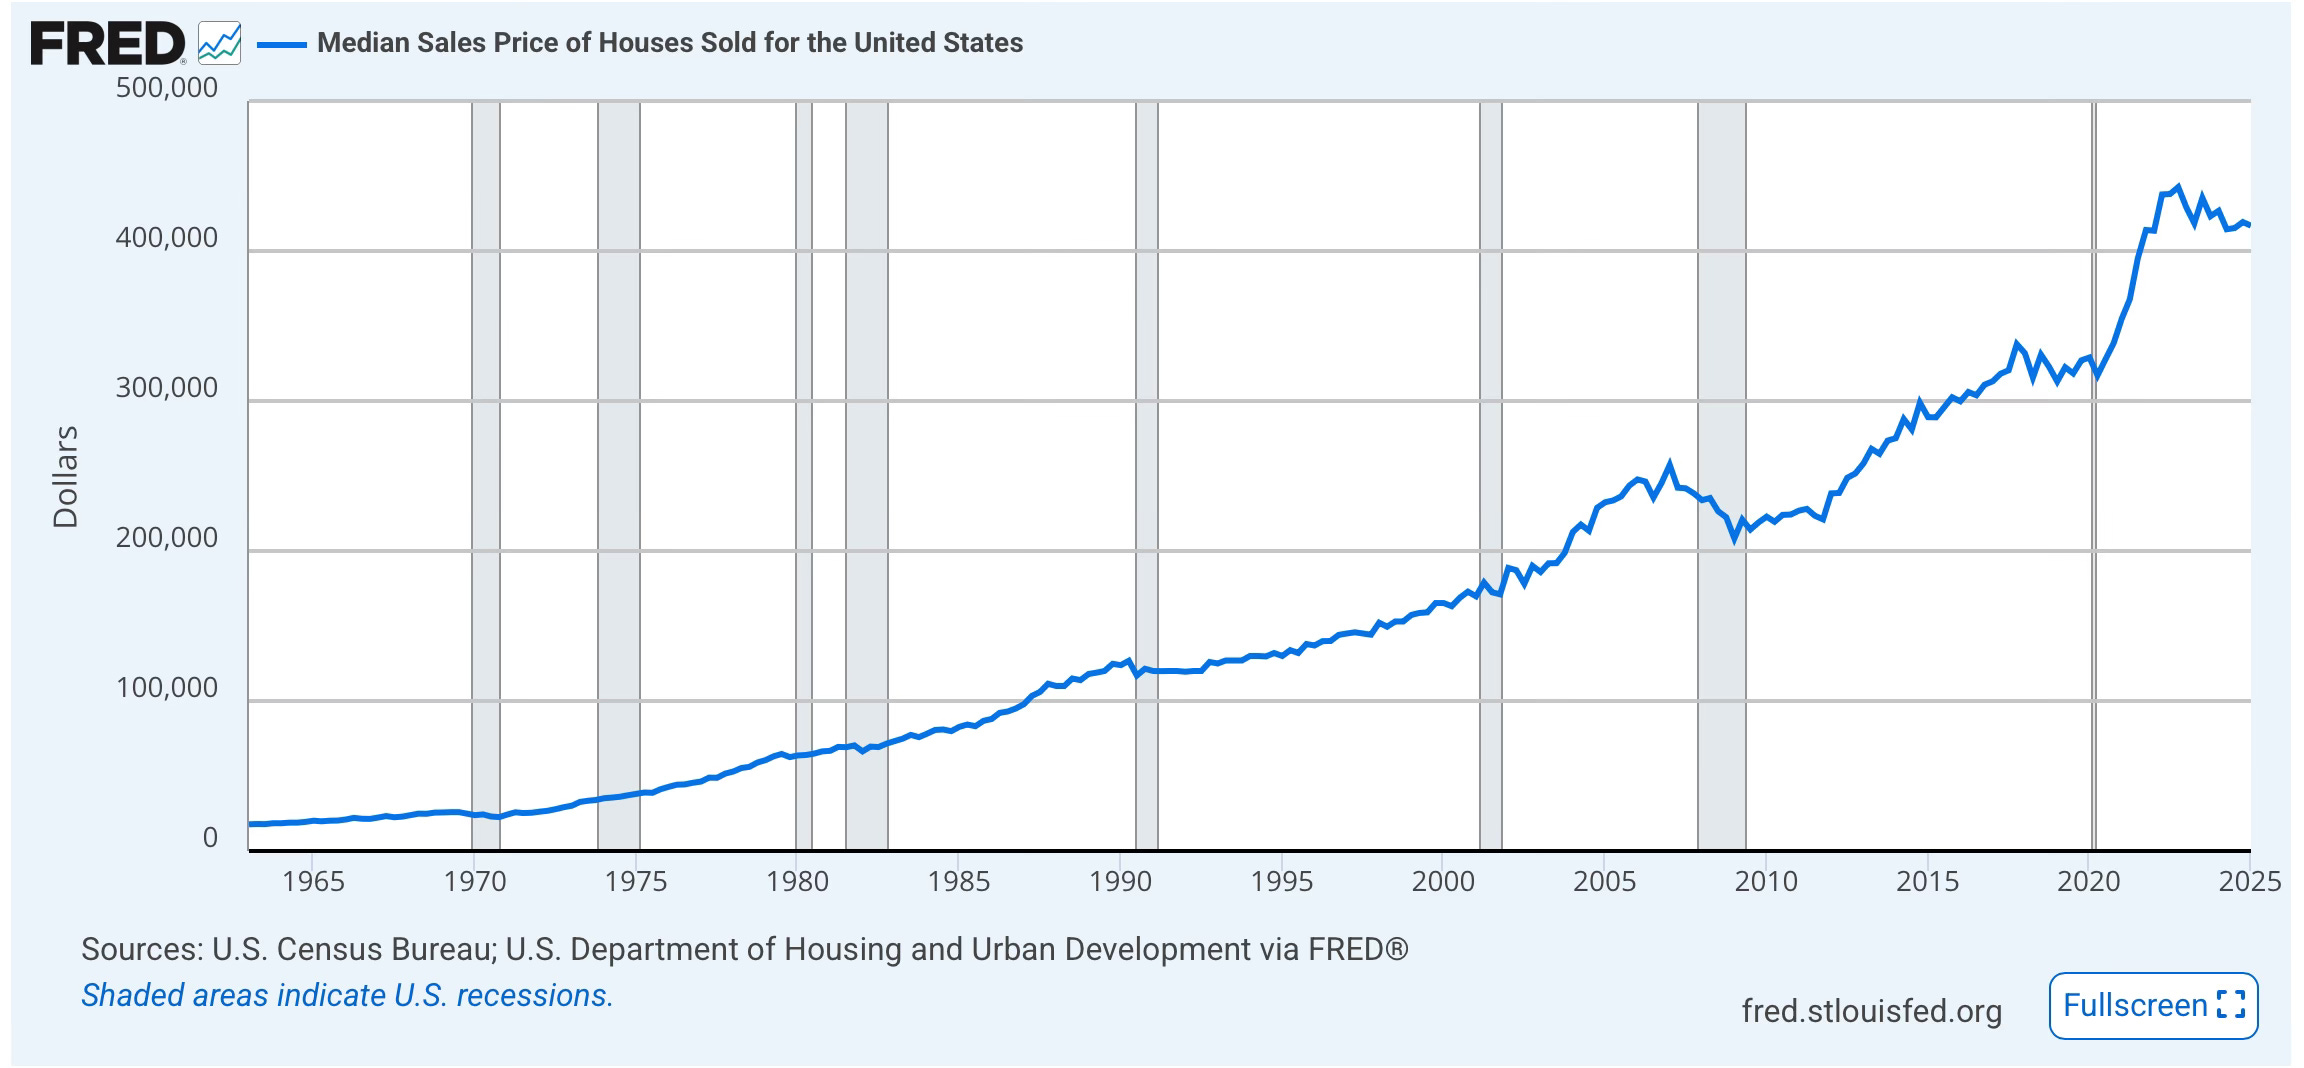
Even the most major housing bust of our generation, the 2008 Financial Crisis, looks like just a temporary valley on the way to higher and higher peaks when you look at in retrospect and in the context of 60 years of price history. Home prices rise over the long haul under almost any time horizon.
You can also get a sense from looking at this chart about how abnormal the pandemic-era run-up was in home prices. The sharp jump on the far right side of the chart feels artificial considering the more sloping upward trend over the previous decades. I’m not a “what goes up, must come down” kind of thinker when it comes to home prices or investments in general, but I think it’s fair to deduce that the home market has been due for a little bit of a correction following such a unique run-up that we saw from 2020-2023.
With all of that in mind, even if there is more of a drawdown in prices over the months or perhaps several years ahead, it’s more likely than not that home prices five, ten, and fifteen years from now will be higher than they are today.
It’s interesting to look at previous periods of pullbacks to get a sense of what a moderate period of falling home prices could look like, however. Here are three:
In 1970, the U.S. experienced a mild recession. The median home price peaked at $25,900 in Q3 of 1969, and the bottomed out at $22,600 in Q4 of 1970. Prices regained the previous peak by Q2 of 1971.
This represents a max drawdown of 12.7%, five quarters from peak to trough, and seven quarters to regain the original peak.
In 1990, the U.S. experienced a similar, short recession. The median home price peaked at $126,800 in Q2 of 1990, and bottomed out at $117,000, just one quarter later in Q3. Prices did not regain their previous peak until Q2 of 1993, however.
This represents a max drawdown of 7.7%, one quarter peak to trough, and 12 quarters to regain the original peak.
During the Great Recession in 2008, home prices peaked at $257,400 in Q1 of 2007. They dropped to $208,400 in Q1 of 2009, a decline of 19.0%. This was nine quarters peak to trough, and it did take all the way until Q1 of 2013 to regain the previous peak, a period of 24 quarters.
There have been other brief periods of time that home prices have dropped, but often for specific reasons. For example, the median home price dropped from $179,000 to $171,100 in the fall of 2001 — likely a result of the peril, economic and otherwise, people felt in the aftermath of September 11th. Prices also dropped momentarily in the spring of 2020 at the outset of the pandemic, for similar reasons of human behavior and psychology related to the uncertainty and angst of that moment in time. And actually, I did not realize this until researching further, the 1990 drop noted in the bullet-points above corresponded with the beginning of the first Gulf War, which may had had a similar effect on buyer behavior.
With all of that in mind, it’s hard to predict what home prices will do by looking at previous drops, as no two are alike and no set of variables is quite like what we are seeing before. But two things are true here at the same time. One, home prices can fall. We may be in one of those moments in time now. Three overlapping catalysts are in place for that to happen: we have just experienced a major run-up in prices over the past few years, so we are due for some correction, the math of high prices and high interest rates is sending buyers to the sidelines, and Americans are feeling anxious about the overall economy.
But the second thing that is true is that home prices do rise in the long-run. If past drops are any indication, home prices could drop 10-20% and perhaps more if the economy ends up in an extended downturn (which no one can exactly predict with any certainty). It has taken generally between two and six years to regain the previous peak, so if prices do fall, it is likely they will rebound in due time. So if you’re a buyer, it is important to monitor the market. For reasons I laid out at the start of the year in my Housing Market 2025 Preview article, I think there is more downward pressure than upward pressure in home prices, so there may be some hope in store for those who have been frustrated and pushed to the sidelines in the current market.
The Sunday Morning Post is always free, never pay-walled, and contains no ads. To learn how you can support this work and keep these articles free from clutter, become a paid supporter here or click to read more here.
Ben Sprague lives and works in Bangor, Maine as a Senior V.P./Commercial Lending Officer for Damariscotta-based First National Bank. He previously worked as an investment advisor and graduated from Harvard University in 2006. Ben can be reached at ben.sprague@thefirst.com or bsprague1@gmail.com.
Ben, a good deal of wisdom. What is paid for an investments matters.